Case Study: How Does a Bike-Share Navigate Speedy Success
Hartmut Schaefer
I. Introduction
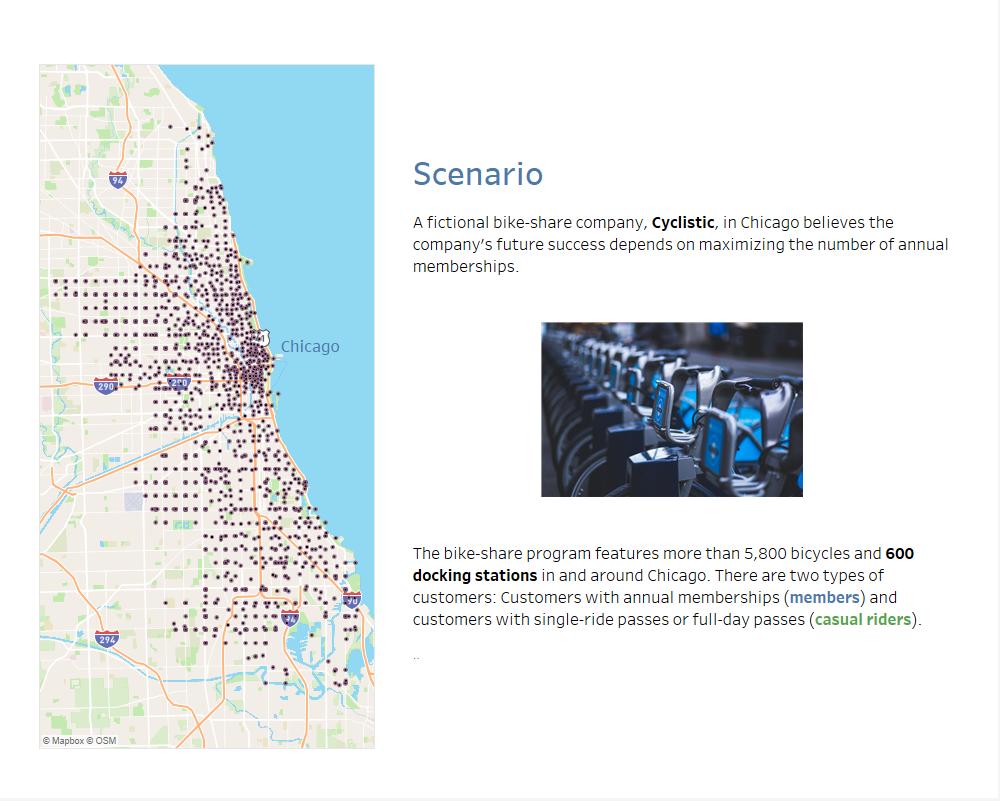
1. Scenario
2. Stakeholders
- Director of marketing, Lily Moreno, my manager: She is responsible
for marketing campaigns to promote the bike-share program.
- Marketing analytics team: A team of data analysts, responsible for
collecting, analyzing, and reporting data for the market strategy. I am
a junior data analyst of this team.
- Executive team: Will decide whether to approve the recommended
marketing program.
3. Data Analysis Process
To answer the business question, we will follow the data analysis
process: ask, prepare, process, analyze, share, and
act.
3.1 Ask
Three questions will guide the marketing program:
- How do annual members and casual riders use Cyclistic bikes
differently?
- Why would casual riders buy Cyclistic annual memberships?
- How can Cyclistic use digital media to influence casual riders to
become members?
The marketing director has assigned me to answer the first
question?
How do annual members and casual riders use Cyclistic bikes differently?
3.2 Prepare
For the data analysis we will use trip data from previous 12 months
from this source.
(Note: The data has been made available by Motivate Inernational
Inc. under this license.)
3.3 Process
a) Choose the right tools:
The use of spreadsheets can be ruled out due to the large data size, leaving us with SQL or R as best choices.
Project 1:
- Excel (Pivot and Graphs): For an ad-hoc analysis with a
single sample file.
- SQL Server Management Studio: For data import and
cleaning
- Tableau desktop: for data exploration, visualization, and
reporting
Project 2:
- R: RStudio/ RMarkdown: for a more in-depth analysis and for
reporting
- GitHub: reporting and code sharing
b) Data integrity
Data integrity is to ensure that the data sample is sufficient, has
no bias, represents the population, is accurate and trustworthy.
In this project the data sample represents the total population of one
year, is therefore not biased, and the data are from first party.
c) Cleaning the data
The provided raw data are already in relative clean condition.
Nevertheless, the following cleaning steps are still required:
- removing missing data
- removing irrelevant data
- handling datetime
- removing duplicates
- computing new variables for further analysis
- removing outliers
3.4 Analyze
In the analysis process the cleaned dataset is aggregated in various
ways to answer questions about trends per year, week, day, bike type and
location. The results are summarized in visualization.
3.6 Act
Recommendations are stated in each report.
Appendix
Additional information from Chicago Bike Share Program “DIVVY”
Source: DIVVY website (as of Mar 2023): Link
Pricing program according to DIVVY website:
- Casual rider - Single Ride
- classic bike:
- $1 to unlock plus free 30 minutes + $0.17/minute after 30
minutes
- $1 to unlock plus free 30 minutes + $0.17/minute after 30
minutes
- Electric bike:
- $1 to unlock + $0.42/minute
- $1 to unlock + $0.42/minute
- classic bike:
- Casual rider - Day Pass (for visitors)
- Classic bike
- $16.50 for unlimited 3h rides within 24h period
- $16.50 for unlimited 3h rides within 24h period
- Classic bike
- Annual member (for locals) $119/year
- Classic bike:
- unlimited 45-minute rides + $0.17/minute if exceeded
- unlimited 45-minute rides + $0.17/minute if exceeded
- Electric bike:
- $0 to unlock + $0.17/minute
- $0 to unlock + $0.17/minute
- Classic bike:
Lost or stolen bike fee is $1200.
In order to avoid extra per minute fees it is recommended to change
the bike or to lock and unlock it again. In case of:
- casual and classic bike (single ride) every 30 minutes
- casual and classic bike (day-pass) every 3 hours
- member and classic bike every 45 minutes
From the pricing program the following user behavior is
expected:
- Casual riders will typically have ride times of 30 minutes and a max
ride time of 3 hours
- Member riders will have a max ride time of 45 minutes
- Exceeding 3 hours will be rear due to the high accumulating
minute-fees